

While it’s true that Scatter plot matrix (SPM) is made of scatter charts for each pair of numeric variables, this description entirely misses the point about how well SPMs simplify complex visuals. They reduce multi-dimensional space into its most relevant 2D snapshot components.
Here's an example from Iris Dataset

The 3D plot looks great - for a prop in a sci-fi flick. But, its nothing short of a brain teaser if the intent is to discover insight here.
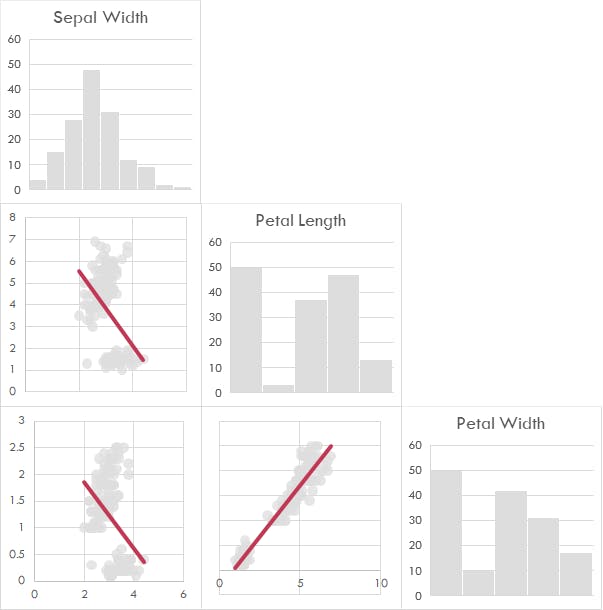
SPM reduces this visual to its 3 most useful snapshots – correlation between 3 variables. Simple. While this is an example of flattening 3 dimensions – SPM can flatten any number of dimensions which, I think, is its superpower.
But, why excel?
When poets and painters must interact with your visuals, SPM in excel combined with slicers for categorical variables is a delight. Static JPEGs give way to dynamic visuals ready for exploration.
Admittedly, scatter plot matrices in excel is a not for faint hearted. Even put mildly, its a rather tedious job - Begin with numeric columns, construct scatter plots for each pair, align them in a matrix and group plots into a single visual - as opposed to only a handful lines of code in R or Python.
Building SPM in Excel isn’t complex. But, as number of variables (columns) grow, the number of scatter plots and effort to build them grow exponentially.
Microsoft will likely offer as a standard chart option. Until then, here’s the .xlsm file to automatically build scatter plot matrices.
Download File Here
Here’s how to use file:
- Paste dataset in worksheet
- Press
ALT+F8(Or click View > Macros > View Macros) - With
AAA.ScatterplotMatrixselected, clickRun - Verify the table range selected, then click
OK
And the code for update if you are into that kinda thing
Option Explicit
Dim TABLE As ListObject
Dim CHART As ChartObject
Dim CNAME As String
Dim TRANGE As String
Dim YAXIS As Variant
Dim XAXIS As Variant
Dim RSQR As Double
Dim COLCNT As Integer
Dim CSIZE As Integer
Dim CSTYL As Integer
Dim ROWNUM As Integer
Dim COLNUM As Integer
Dim i As Integer
Dim ii As Integer

Sub AAA_ScatterPlotMatrix()
    Application.ScreenUpdating = False
    On Error Resume Next
    UnlistAllTables
    DeleteAllCharts
    DeleteEmptyRowsAboveTable
    DeleteEmptyColumnsLeftofTable
    SetCSIZEAndCSTYL
    CreateSPMtable
    COLCNT = TABLE.ListColumns.Count
    For i = COLCNT To 1 Step -1
        Set YAXIS = TABLE.DataBodyRange.Columns(i)
        Set XAXIS = TABLE.DataBodyRange.Columns(i)
        CalculateRSquare
        If Err = 0 Then
            For ii = 1 To i
                Set XAXIS = TABLE.DataBodyRange.Columns(ii)
                CNAME = "chart" & i & ii
                CalculateRSquare
                If Err = 0 Then
                    If i = ii Then
                        CreateHistogram
                        Else
                        CreateScatterPlot
                        AddRSQRlabel
                        FormatTrendLine
                        FormatRsuaredlabel
                    End If
                End If
            Next ii
        End If
    Next i
    AllignChartsToSameLocation
    ROWNUM = 1: COLNUM = 1: i = 1
    Do While i <= COLCNT
        On Error Resume Next
        ActiveSheet.ChartObjects("chart" & i & i).Activate
        If Err.Number = 0 Then
            ii = 1: COLNUM = 1
            Do While ii <= i
                ActiveSheet.ChartObjects("chart" & i & ii).Activate
                If Err.Number = 0 Then
                    On Error Resume Next
                    ActiveSheet.Shapes("chart" & i & ii).IncrementTop (CSIZE * ROWNUM)
                    ActiveSheet.Shapes("chart" & i & ii).IncrementLeft (CSIZE * COLNUM)
                    COLNUM = COLNUM + 1
                End If
                ii = ii + 1
                Err.Number = 0
            Loop
            ROWNUM = ROWNUM + 1
        End If
        i = i + 1
    Loop
    GroupScatterPlots
    MoveScatterPlotMatrix
    Application.ScreenUpdating = True
End Sub

Sub UnlistAllTables()
    For Each TABLE In ActiveSheet.ListObjects
        TABLE.Unlist
    Next
End Sub

Sub DeleteAllCharts()
    For Each CHART In ActiveSheet.ChartObjects
        CHART.Delete
    Next
End Sub

Sub DeleteEmptyRowsAboveTable()
    Do While WorksheetFunction.CountA(Rows(1)) = 0
        Rows(1).Delete
    Loop
End Sub

Sub DeleteEmptyColumnsLeftofTable()
    Do While WorksheetFunction.CountA(Columns(1)) = 0
        Columns(1).Delete
    Loop
End Sub

Sub SetCSIZEAndCSTYL()
    'user inputs'
    CSIZE = 150
    CSTYL = 1
End Sub

Sub CreateSPMtable()
    Application.ScreenUpdating = True
    TRANGE = Application.InputBox("Table Range", "Is this the table range?", Range("A1").CurrentRegion.Address, Type:=8).Address
    Application.ScreenUpdating = False
    ActiveSheet.ListObjects.Add(xlSrcRange, Range(TRANGE), , xlGuess).Name = "SPM"
    Set TABLE = ActiveSheet.ListObjects("SPM")
End Sub

Sub CalculateRSquare()
    On Error Resume Next
    RSQR = Application.WorksheetFunction.RSq(YAXIS, XAXIS)
End Sub

Sub CreateHistogram()
    YAXIS.Select
    ActiveSheet.Shapes.AddChart2(366, xlHistogram, , , CSIZE, CSIZE).Select
    ActiveChart.Parent.Name = CNAME
    ActiveChart.ChartTitle.Select
    Selection.Caption = TABLE.HeaderRowRange.Columns(i).Value
    'delete below line to add y-axis to histogram'
    ActiveChart.SetElement (msoElementPrimaryCategoryAxisNone)
    'delete below line to add x-axis to histogram'
    ActiveChart.SetElement (msoElementPrimaryValueAxisNone)
End Sub

Sub CreateScatterPlot()
    Range(YAXIS.Address & "," & XAXIS.Address).Select
    ActiveSheet.Shapes.AddChart2(269, xlBubble, , , CSIZE, CSIZE).Select
    With ActiveChart
        .Parent.Name = CNAME
        .ChartGroups(1).BubbleScale = 20
        .ClearToMatchStyle
        .CHARTSTYLE = 268 + CSTYL
        'delete below line to add chart title to scatterplot'
        .SetElement (msoElementChartTitleNone)
        ' delete below line to add y-axis to scatterplot'
        .SetElement (msoElementPrimaryCategoryAxisNone)
        ' delete below line to add x-axis to scatterplot'
        .SetElement (msoElementPrimaryValueAxisNone)
        'delete below line to add data labels'
        .SetElement (msoElementDataLabelNone)
        ' delete below line to remove trendline'
        .FullSeriesCollection(1).Trendlines.Add
    End With
End Sub

Sub AddRSQRlabel()
    ActiveChart.FullSeriesCollection(1).Trendlines(1).Select
    'delete this line to remove r-squared label'
    Selection.DisplayRSQR = True
End Sub

Sub FormatTrendLine()
    With Selection.Format.Line
        .Visible = msoTrue
        .Weight = 3
        .DashStyle = msoLineSolid
        .ForeColor.RGB = RGB(192, 56, 84)
    End With
End Sub

Sub FormatRsuaredlabel()
    On Error Resume Next
    ActiveChart.FullSeriesCollection(1).Trendlines(1).DataLabel.Select
    If Err.Number = 0 Then
        With Selection
            .Left = 0
            .Top = CSIZE
        End With
    End If
    Err.Number = 0
End Sub

Sub AllignChartsToSameLocation()
    ActiveSheet.Shapes.SelectAll
    Selection.ShapeRange.Align msoAlignCenters, msoFalse
    Selection.ShapeRange.Align msoAlignMiddles, msoFalse
    Selection.ShapeRange.Align msoAlignRights, msoFalse
    Selection.ShapeRange.Align msoAlignTops, msoFalse
End Sub

Sub GroupScatterPlots()
    ActiveSheet.Shapes.SelectAll
    Selection.ShapeRange.Group.Select
    Selection.ShapeRange.Name = "CMatrix"
End Sub

Sub MoveScatterPlotMatrix()
    ActiveSheet.Shapes.Range(Array("CMatrix")).Select
    With Selection
        .Placement = xlFreeFloating
        .ShapeRange.LockAspectRatio = msoTrue
        .Cut
    End With
    Cells(1, COLCNT + 2).Activate
    ActiveSheet.Paste
    ActiveWindow.Zoom = True
    Range("A1").Select
End Sub
* The post Build SPM in spreadsheets first appeared on continuoous.com